Community Corner
Pleasanton Students Score Well in Fitness Tests
The California Department of Education released its latest fitness test results for the 2011-2012 school year.

A vast majority of Pleasanton Unified students are posting healthy scores on a battery of tests designed to gauge physical fitness, according to the latest reports from the California Department of Education.
Pleasanton's numbers were generally significantly better than Alameda County overall.
What do you do to make sure your kids stay active and eat healthy foods?
Find out what's happening in Pleasantonwith free, real-time updates from Patch.
The 2012 Physical Fitness Test was administered to approximately 1.3 million fifth-, seventh- and ninth-graders, approximately 93 percent of the students enrolled in those grades throughout the state, with between 13,000 and 15,000 in each of the three grade levels tested in Alameda County.
Pleasanton Unified School District, Physical Fitness Test 2011-2012 Physical Fitness Area % Grade 5 Students in HFZ* % Grade 5 Students in Needs Improve- ment - High Risk % Grade 7 Students in HFZ* % Grade 7 Students in Needs Improve- ment - High Risk % Grade 9 Students in HFZ* % Grade 9 Students in Needs Improve- ment - High Risk Aerobic Capacity 87.8 4.2 84.9 4.2 86.7 3.2 Body Composition 69.4 19.2 73.1 15.3 73.6 14.2 Abdominal Strength 85.8 N/A 92.2 N/A 94.9 N/A Trunk Extension Strength 80.6 N/A 88.4 N/A 94.3 N/A Upper Body Strength 72.3 N/A 74.2 N/A 92.5 N/A Flexibility 73.9 N/A 68.6 N/A 95.9 N/A *Fitness Health Zone Source: California Department of EducationThe FITNESSGRAM test is designed to evaluate fitness performance has six individual tests including aerobic capacity, body composition, abdominal strength, trunk extensor strength, upper body strength, and flexibility.
Find out what's happening in Pleasantonwith free, real-time updates from Patch.
The California State Board of Education designated the FITNESSGRAM in 1996 as the required Physical Fitness Test that local educational agencies administer to students annually in grades five, seven, and nine. State law requires all public schools in California to report these results in their School Accountability Report Cards and provide students with their individual results.
“When we can call fewer than one out of three of our kids physically fit, we know we have a tremendous public health challenge on our hands,” State Superintendent of Public Instruction Tom Torlakson said. “It affects more than their health—study after study has demonstrated the very clear link between physical fitness and academic achievement.
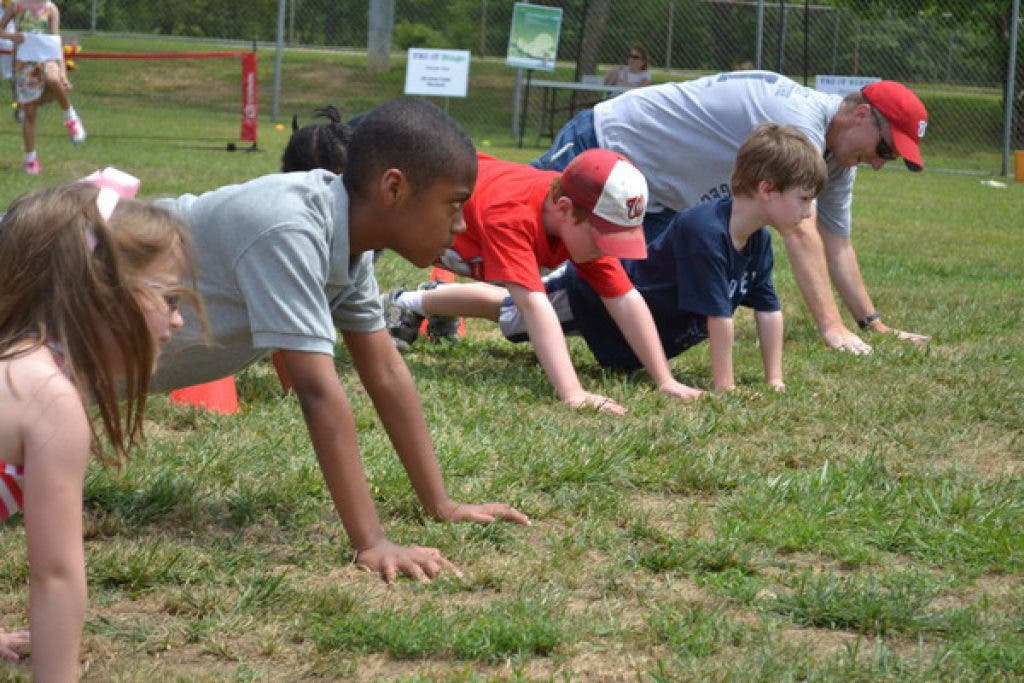
With shrinking school budgets, daily physical education programs and outdoor activities often do not make the cut. Many schools rely on nonprofit organizations to provide bi- or tri-weekly activity for students.To test Aerobic Capacity, students are measured on a one-mile run. Body Composition is quantified by skinfold measurements. Abdominal Strenth and Endurance is measured by curl-ups, and Truck Extensor Strength and Flexibility is measured by a trunk lift (in inches.) Upper Body Strength and Endurance is measured by 90 degree push-ups, a modified pull-up and flexed arm hang. Lastly, Flexibility of measured by a sit-and-reach and a shoulder stretch (Touching fingertips together behind the back on both the right and left sides.)
How recorded scores are classified can be viewed in this PDF on the state’s website.
However, Torlakson said he was pleased to observe that students generally became more fit as they grew older, scoring better in Grades 7 and 9 than they did as fifth graders.
Torlakson’s Team California for Healthy Kids initiative engages celebrity athletes, community leaders, public health advocates, parents, teachers, and students to partner together to help students make healthy choices.
Get more local news delivered straight to your inbox. Sign up for free Patch newsletters and alerts.


